mining
Reading wear patterns
A worn liner records what has run through the plant. Where the loss sits — and where it does not — often identifies the cause faster than an instrument.
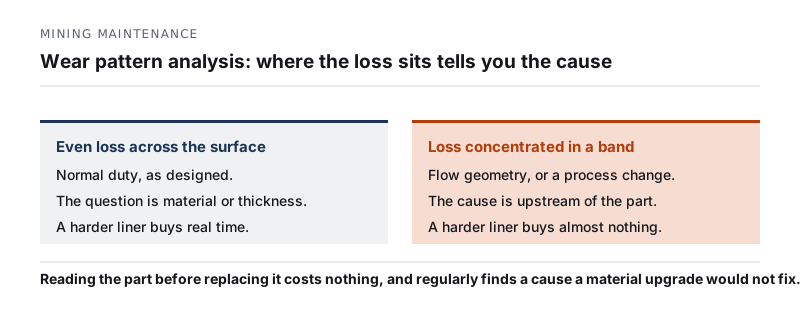
Wear is almost never uniform, and where it concentrates is diagnostic. A narrow band points to flow geometry, a shifted pattern to a process change, symmetrical loss to normal duty. Reading the part before replacing it costs nothing and regularly finds a cause a material upgrade would not fix.
A worn liner leaving a mill carries more process information than most of the instrumentation around it. It has spent months integrating everything the plant has done — feed changes, throughput increases, flow disturbances — and the record is written on its surface.
It is usually scrapped without anyone looking at it.
Uniform wear is the exception
The default assumption is that a component wears evenly and is replaced when it is thin. In practice the loss is almost always uneven, and the shape of that unevenness is the diagnostic.
Concentrated in a narrow band. Flow is being directed at that line. This is geometry, not material — and the answer is to move the stream, fit a sacrificial element there, or accept and plan for it. A harder material in this position buys some time and leaves the cause untouched.
Shifted from where it used to be. Something has changed: feed point, particle size distribution, throughput, a partial blockage upstream. The part is reporting a process change that may not have been noticed elsewhere.
Heavier on one side of a symmetrical assembly. Alignment, distribution or an installation issue. Worth resolving, because it will repeat with the replacement.
Even and symmetrical. Normal duty. This is the case where a material comparison is genuinely the right lever.
Where the pattern is most informative
Mill liners — the wear profile changes grinding action long before the liner is thin. Lifters that have worn rounded no longer lift the charge as designed, and throughput and grind size drift with them. Replacement is often justified by the profile rather than by remaining thickness, and a plant that replaces on thickness alone may be running months of degraded grinding it has not attributed to anything.
Pump impellers and casings — wear degrades hydraulic efficiency continuously. The energy cost of that degradation accumulates quietly and frequently exceeds the cost of the wear part itself. The pattern also distinguishes causes: cavitation damage looks different from abrasion, sits in different places, and calls for a different remedy.
Chutes and transfer points — wear marks the impact zone precisely. It shows where the stream actually lands, which is regularly not where the design intended.
Pipe bends — loss on the outer radius is expected. Loss elsewhere indicates the flow regime is not what was assumed, often because velocity or solids concentration has moved away from design.
Note
Photograph worn parts before they leave site, with a scale in frame and the fitted orientation noted. It costs a minute and it is the only record that survives. Comparing this change to the last one is where the diagnosis lives.
Measure a few points consistently, not many points once
Detailed one-off surveys are less useful than a simple set of measurements taken the same way at every change.
Define a small number of points — four to six is enough for most components — mark them so the same locations are used every time, and record remaining thickness at each along with hours or tonnes in service. The absolute values matter less than the trend, and the trend only exists if the method stays constant.
That trend answers questions that no single inspection can: whether wear rate is stable or accelerating, whether a material change actually helped, and whether a process change had a maintenance consequence nobody linked to it.
Wear rate is not linear
Extrapolating early measurements to predict a replacement date almost always overestimates remaining life.
The reason is that wear changes flow. As a profile degrades, the path shifts, turbulence increases, impact angles worsen, and the rate rises. The last portion of a component’s life is shorter than the first — sometimes considerably.
Planning on linear extrapolation produces a replacement date that arrives after the component actually needed changing. In a shutdown-governed plant, that error surfaces as an unplanned stop.
Limits of use
Wear patterns identify where and suggest why. They do not measure process parameters. Where the pattern indicates a change — a shifted impact zone, an accelerating rate — confirm it against process data before acting on the interpretation.
The question worth asking at every change
Before ordering a replacement, one question separates a fix from a repetition: is this wear pattern what I expected?
If yes, the decision is about material, interval and cost. If no, something has changed, and fitting an identical part means the same outcome will arrive on the same schedule.
Most upgrades that disappoint were answers to the first question, applied to a situation that was actually the second.
Frequently asked questions
What should be recorded when a worn part is removed?
Why does one liner in a set wear faster than the others?
Can wear rate be used to predict remaining life?
Is uneven wear always a problem to correct?
Sources and references
- StandardASTM G75-15(2021) — Standard Test Method for Slurry Abrasivity (Miller Number) — édition liée ; G75-24 est en vigueurASTM International · accessed August 8, 2026
- StandardASTM G65-16(2021) — Standard Test Method for Measuring Abrasion Using the Dry Sand/Rubber Wheel ApparatusASTM International · accessed August 8, 2026
Request a technical review
Describe your equipment and the problem. You get an engineering answer, not a sales pitch.